MasterMind Display Metrics Explained
This article is no longer maintained here. Please copy this link and paste it into the URL bar of your browser to see the latest version:
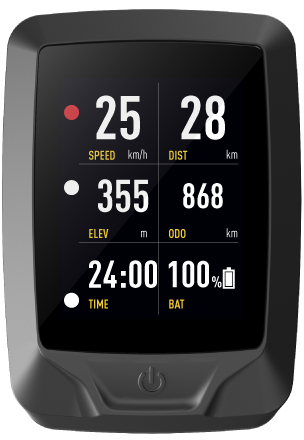
This article explains the display metrics as configurable on MasterMind displays.
Please watch this video to learn how to customize the screens on a MasterMind display.

ALTITUDE
| METRIC NAME | DISPLAY SHORT FORM* | EXPLANATION |
|---|---|---|
| Altitude | alt | Displays the vertical distance from mean sea level to the point being measured. Unit: meters or feet Altitude is measured through a pressure sensor in the display. Air pressure changes require calibration before a ride to get accurate data. There are two methods of calibrating the altitude: 1. Use the remote to enter the setup menu and calibrate the elevation manually (simultaneous long double press of +/- on the remote). You need to know your current altitude. 2. In Mission Control (2.8.0 and later), activate "Calibrate Bike To Phone Elevation" (MY BIKES). The phone needs to have a barometric sensor to use this function. Accuracy depends on the phone sensor. Further Reference: YouTube video: https://www.youtube.com/watch?v=Ps5agxpZCj0 |
| Altitude Gain | alt gain | Displays the relative vertical distance a rider gained since resetting the field to 0. Data is cumulative. This metric field is limited to 4 characters, meaning 9999 (ft or m) is the maximum value. Unit: meters or feet To see data for a particular ride, zero altitude gain before starting a new ride (long press on minus-button of remote). Note that all other resettable data will be zeroed as well. |
| Altitude Descent | alt desc | Displays the relative vertical distance a rider lost since resetting the field to 0. Data is cumulative. This metric field is limited to 4 characters, meaning 9999 (ft or m) is the maximum value. Unit: meters or feet To see data for a particular ride, zero altitude descent before starting a new ride (long press on minus-button of remote). Note that all other resettable data will be zeroed as well. |
CADENCE
| METRIC NAME | DISPLAY SHORT FORM* | EXPLANATION |
|---|---|---|
| Cadence | cad | Displays the amount of crank revolutions a rider does per minute. Unit: rpm (revolutions per minute) Cadence is measured through a sensor in the motor and can also be displayed on ANT+ devices by connecting to the motor sensor through the display; to connect an ANT+ device, use the display setup menu (simultaneous long press of +/- buttons). For best efficiency, range and motor support it is recommended to spin in cadences of 75+. |
| Average Cadence | avg cad | The median value of crank revolutions a rider does per minute. Unit: rpm (revolutions per minute) |
| Max Cadence | max cad | The maximum value of crank revolutions a rider achieved. Unit: rpm (revolutions per minute) |
CLOCK
| METRIC NAME | DISPLAY SHORT FORM* | EXPLANATION |
|---|---|---|
| Clock | clock | Shows the time of the day. Unit: hours and minutes (12h or 24h) The clock is set by connecting the display to Mission Control or Turbo Studio (retailers only). It can also be set using the display setup menu (simultaneous long press of +/- remote buttons). A display reset makes the clock default to a certain value (e.g. 2.00 pm). |
| Total Time | tot time | References the total (accumulated) time since resetting the field to 0. Unit: hours and minutes (12h or 24h) Includes the stopped time. Charging the bike battery stops all timers. Calculation: total stopped time + total riding time |
| Stopped Time | stop time | Shows the time the bike was not moving since resetting the field to 0. Unit: hours and minutes (12h or 24h) Stopped time applies whenever the bike speed is smaller 3 kph. Charging the bike battery stops all timers. |
| Riding time | ride time | Shows the moving time since resetting the field to 0. Unit: hours and minutes (12h or 24h) Riding time states the amount of time during which bike had a speed higher than 3 kph. |
DIAGNOSE
| METRIC NAME | DISPLAY SHORT FORM* | EXPLANATION |
|---|---|---|
| Battery Level | batt | Shows the current charge level of the bike battery. Unit: per cent The font colour of the battery level figure turns orange or red to indicate low state of charge and the technically required motor power reduction at certain charge levels (reduction starts at 20 or 15% in normal battery temperature range and depending on the system). |
| Consumption | avg cons | Shows the battery consumption in watt hours per kilometer or mile. Unit: watt hours The higher the number, the larger the consumption. |
| Slope | slope | Shows the gradient of the current surface the bike is moving on. Indicates the positive or negative steepness. Units: per cent To calculate the slope, the rolling changes in altitude are used. Be aware that slope measurements appear with a certain delay since a rolling average is used. |
| AXS Battery Level | RD battery | Note: this requires MasterMind TCU firmware 31.C.0. or higher and the latest Mission Control version. It is important to follow these exact steps to display AXS information on the MasterMind display. Before you start the process, ensure the MasterMind TCU and AXS derailleur run on the latest firmware. Update through Mission Control and/or AXS app. 1. Turn on bike 2. Make sure AXS components are awake by gently shaking the bike (confirm by shifting up and down) 3. Enter setup menu of MasterMind display (keep +/- buttons on remote pressed) 4. Navigate to: Sensors / Pair ANT / Shifting 5. Confirm “Shifting” with F1 remote button 6. Make sure pairing to AXS is confirmed on MasterMind display 7. Open Mission Control and connect to bike 8. Go to TUNE and CUSTOMIZE DISPLAY 9. Create AXS display field to see AXS data on MasterMind display Tips in case pairing fails: 1. Do NOT create the MC metric fields before pairing AXS sensors to MasterMind TCU 2. Ensure all components are up-to-date, bike display and AXS 3. Reduce the distance between the display and the AXS derailleur: Remove the MasterMind TCU from the frame, gently pull some cable and hold it as close as possible to the rear derailleur for pairing; when re-installing the display, only lightly tighten the TX10 screw (0.8 Nm max.) 4. Run a factory reset for the MasterMind TCU by holding both plus and minus button of the remote down for 45 seconds; the display will reboot twice. Re-attempt pairing. Note for Mission Control: before re-pairing to Mission Control, you need to remove the bike from the Bluetooth device list in your phone. Rear derailleur charge levels as displayed on MasterMind unit. The display converts messages from shift system into these 6 charge level indications: 100% 75% 50% 25% 5% |
| AXS Gear | rear gear | Note: this requires MasterMind TCU firmware 31.C.0. or higher and the latest Mission Control version. It is important to follow these exact steps to display AXS information on the MasterMind display. Before you start the process, ensure the MasterMind TCU and AXS derailleur run on the latest firmware. Update through Mission Control and/or AXS app. 1. Turn on bike 2. Make sure AXS components are awake by gently shaking the bike (confirm by shifting up and down) 3. Enter setup menu of MasterMind display (keep +/- buttons on remote pressed) 4. Navigate to: Sensors / Pair ANT / Shifting 5. Confirm “Shifting” with F1 remote button 6. Make sure pairing to AXS is confirmed on MasterMind display 7. Open Mission Control and connect to bike 8. Go to TUNE and CUSTOMIZE DISPLAY 9. Create AXS display field to see AXS data on MasterMind display Tips in case pairing fails: 1. Do NOT create the MC metric fields before pairing AXS sensors to MasterMind TCU 2. Ensure all components are up-to-date, bike display and AXS 3. Reduce the distance between the display and the AXS derailleur: Remove the MasterMind TCU from the frame, gently pull some cable and hold it as close as possible to the rear derailleur for pairing; when re-installing the display, only lightly tighten the TX10 screw (0.8 Nm max.) 4. Run a factory reset for the MasterMind TCU by holding both plus and minus button of the remote down for 45 seconds; the display will reboot twice. Re-attempt pairing. Note for Mission Control: before re-pairing to Mission Control, you need to remove the bike from the Bluetooth device list in your phone. |
HEART RATE
| METRIC NAME | DISPLAY SHORT FORM* | EXPLANATION |
|---|---|---|
| Heart Rate | hr | Shows a current rider`s heart rate if a Bluetooth or ANT+ heart rate belt is connected to the system. Unit: bpm (beats per minute) To pair a heart rate belt, enter the display setup menu (simultaneous long double press of +/- remote buttons). |
| Average Heart Rate | avg hr | Shows the mean value of all readings if a Bluetooth or ANT+ heart rate belt is connected to the system. Unit: bpm (beats per minute) To pair a heart rate belt, enter the display setup menu (simultaneous long double press of +/- remote buttons). |
| Target Heart Rate | trg hr | to be added soon |
JUMP STATS
| METRIC NAME | DISPLAY SHORT FORM* | EXPLANATION |
|---|---|---|
| Jump Count | jumps | Unit: total/amount Estimates the number of times jumped |
| Jump Distance | lst jump dst | Unit: meters The last jump distance is an estimate of the distance traveled in the air in meters, based on the horizontal take-off speed. |
| Jump Duration | lst jump dur | Unit: Seconds The last jump period is an estimate of the time in the air (seconds) based on the bike entering a free-fall state. |
POWER
| METRIC NAME | DISPLAY SHORT FORM* | EXPLANATION |
|---|---|---|
| Rider Power | rider pow | Displays the power output of the rider. Unit: watts Rider power is measured through a sensor in the motor and can also be displayed on ANT+ devices by connecting to the motor sensor through the display; to connect an ANT+ device, use the display setup menu (simultaneous long press of +/- buttons). |
| Motor Power Electric | mot pow el | The battery output delivered to the bike, including peripherals such as lights. Unit: watts |
| Motor Power Mechanic | mot pow mech | Estimated as 80% of battery output power, since no motor reaches 100% efficiency. Unit: watts |
| Total Power | tot pow | The sum of rider power and mechanical motor power. Unit: watts |
| Average Total Power | avg tot pow | This is the average for motor power and rider power together, calculated over ride time. Unit: watts |
| Power Ratio | pow ratio | `Power Ratio` represents "x times you" expressed in numbers. It is calculated by dividing mechanical motor power by rider power. Example: 167 / 48 = 3.5. This means the motor adds 3.5 times the rider input. The higher the `Power Ratio` value, the more motor support a rider gets from the system and vice versa. Note that this a rough indication since mechanical motor power is estimated as 80% of battery output power, which can be displayed as the electrical motor power (MOT POW EL). |
RANGE
| METRIC NAME | DISPLAY SHORT FORM* | EXPLANATION |
|---|---|---|
| Estimated Range | est range | Estimated range refers to the long range estimate. Range estimation is calculated following an industry convention, using consumption over certain ride intervals (a short and long interval) and battery capacity at the point of calculation. All range data is based on dynamic range estimation; this means the system cannot see into the future, nor have the luxury of knowing what route the rider is doing. The estimated range is calculated based on rolling consumption during riding. The value shown when starting a ride is based on this rolling window of the previous ride and the battery capacity at the start of the new ride. Both "Estimated Range" and "Range Trend" update every 20 m (they don't update if the bike is not moving). The long range estimate is based on a rolling 50 km window, maintained between turning the bike off and on. The range trend indicator is the long range estimate compared to a rolling window of 400 m. Switching/changing support modes does not instantaneously update values for remaining range – you need to do some riding before seeing updated values; similar to changing gear in a car. The range trend shows the impact the current riding is having on the range estimate - use this as an indicator for how reliable the range estimate will be, if one continues with the current riding style. |
| Range (Trend) | range trend | Range trend refers to the short range estimate. The range trend indicator is the long range estimate compared to a rolling window of 400 m. |
RIDE
| METRIC NAME | DISPLAY SHORT FORM* | EXPLANATION |
|---|---|---|
| Motor Odometer | odo | Displays the total distance ridden. Unit: kilometers or miles Motor odometer values are saved within the motor unit itself and cannot be reset. |
| Ride Distance | dist | Displays the distance ridden since the last display reset. Unit: kilometers or miles To see data for a particular ride, zero distance before starting a new ride (long press on minus-button of remote). |
| Current Motor Support | inf tune | Displays the current Support and Peak Power settings as defined per Mission Control or Infinite Tune. Example 35 / 70 = 35% Support and 70% Peak Power Unit: per cent Further References: Videos explaining Support / Peak: |
| Assist Mode | mode | Shows the current mode. Units: TURBO, TRAIL/SPORT, ECO, OFF, MICRO TUNE, SMART CONTROL, WALK ASSIST |
| Calories | kcal | Calculates the approximate total kilocalorie consumption of the rider, calculated from the sum of rider power for the ride. For the calculation, the system uses 1 kilocalorie (kcal) equals 4.184 Joules (J) and human efficiency of 25% such that: Energy (kcal) = Power (watts) * Time (hours) * 3.6 We are basically using this industry approximation. |
| Gear Ratio | gear | This is a feature for bikes equipped with enviolo AUTOMATiQ internal gear hubs. The colored bar on the graph will change according to the current gear ratio and show when you have reached the limits. Note that enviolo enviolo AUTOMATiQ internal gear hubs do not have an unlimited gear ratio and have upper and lower limits. Once these limits have been reached, the bicycle will require more or less effort to pedal the bicycle depending on the gradient. When the gradient is too steep, the motor support and the enviolo IGH may not be able to support your desired pedal pace. |
SPEED
| METRIC NAME | DISPLAY SHORT FORM* | EXPLANATION |
|---|---|---|
| Speed | speed | Displays the current speed a rider is travelling with. Unit: kmph or mph Speed is calculated using the speed sensor system of the bike, together with the wheel circumference stored in the motor. Authorized Specialized retailers can adjust the wheel circumference within a certain legal limit to accommodate for different wheel and tire options. |
| Max. Speed | max spd | Shows the maximum speed since the last display reset. Unit: kmh or mph To see data for a particular ride, zero max. speed before starting a new ride (long press on minus-button of remote). |
*Depends on display type and field configuration; as a rule of thumb, MasterMind TCU uses more abbreviations due to space constraints. On MasterMind TCD, metrics are written in capital letters (e.g. ALTITUDE), whereas MasterMind TCU uses lower case only (e.g. altitude).